ExcelDashboard Ai: Revolutionizing Data Visualization and Analysis
ExcelDashboard Ai is a game-changer in the world of data analysis and visualization. It offers a seamless experience for users looking to transform their Excel data into dynamic and insightful dashboards.
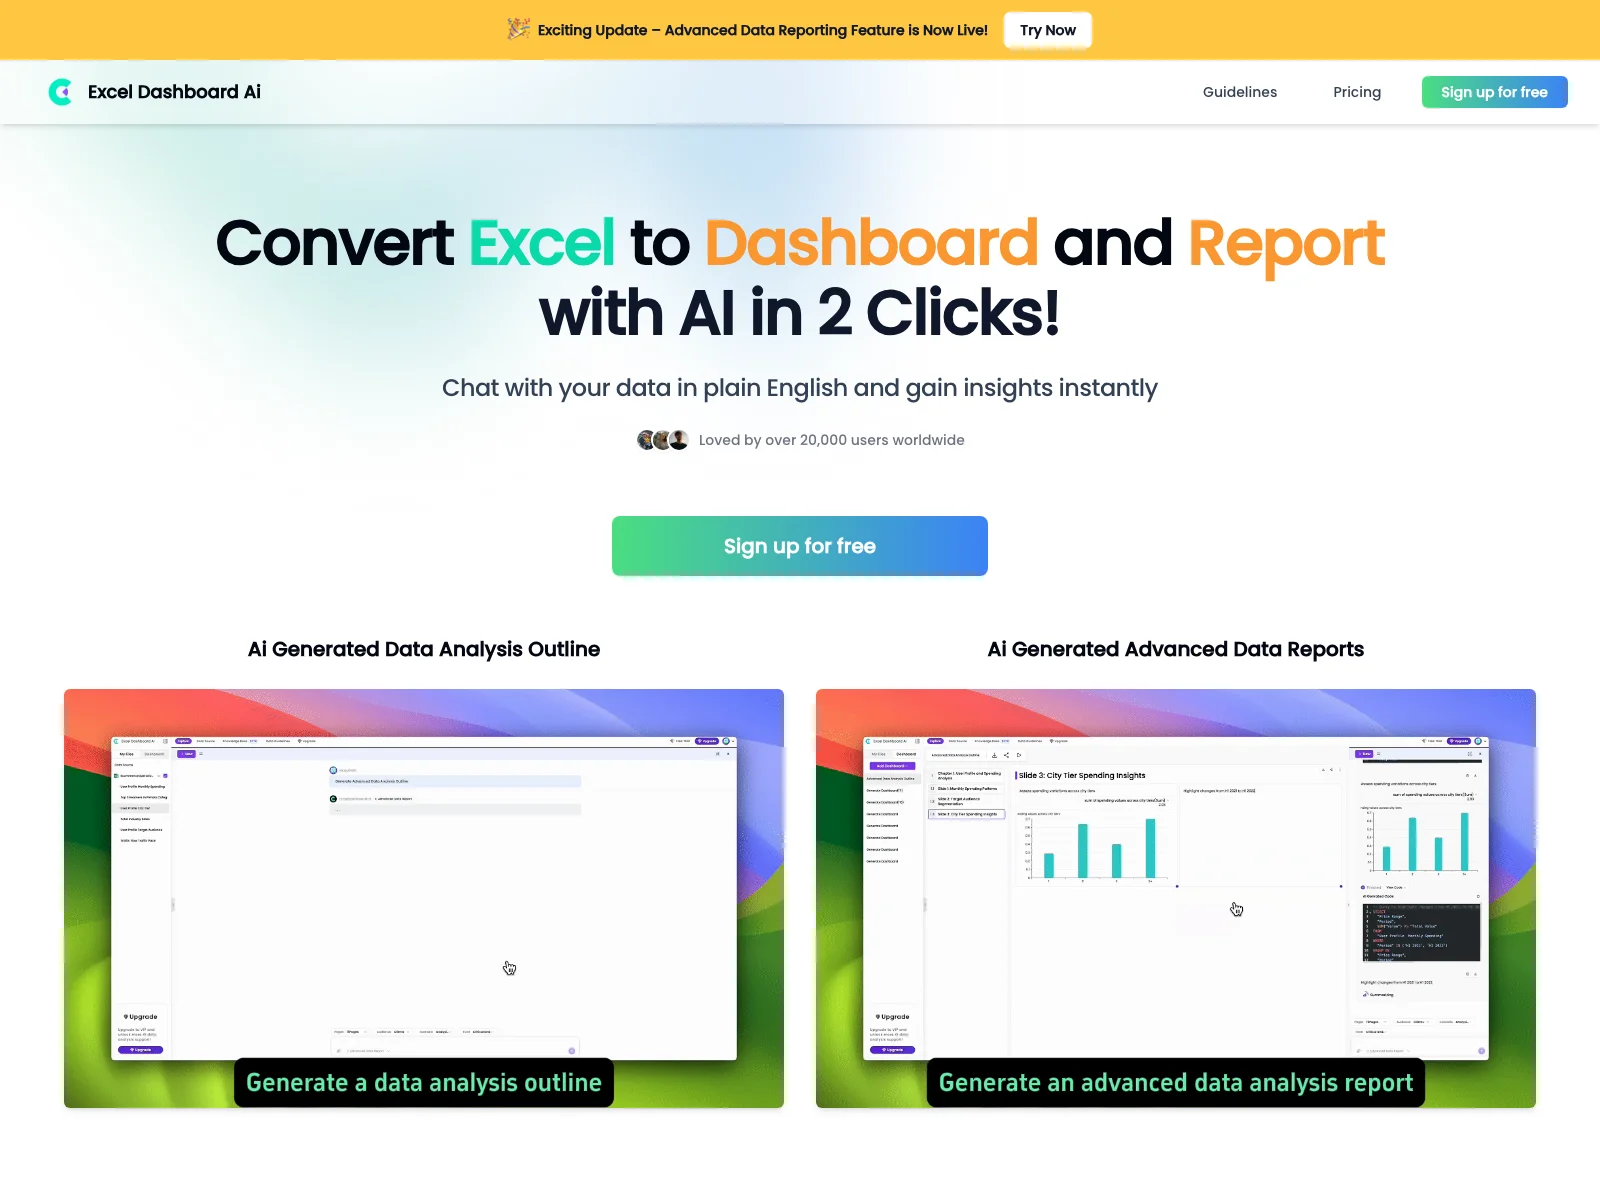
The core features of ExcelDashboard Ai are truly remarkable. It allows users to convert Excel files to dashboards with just a few clicks, saving time and effort. With its advanced data reporting capabilities, users can gain valuable insights into their data quickly and easily.
The basic usage of ExcelDashboard Ai is straightforward. Users can simply upload their Excel files and let the tool do the rest. It handles all the programming and visualization, creating an interactive dashboard in an instant. Users can also ask questions in plain English and receive immediate answers, making data analysis more accessible than ever before.
In addition, ExcelDashboard Ai offers a range of other features. It enables users to generate 10 different data analysis dimensions in seconds, allowing them to choose the most relevant perspectives for their analysis. Users can also edit and lock in their preferred analysis perspectives using natural language. The tool also allows for easy generation of new charts with natural language commands and the addition of these charts to the dashboard with a single click.
Another great feature of ExcelDashboard Ai is its ability to convert dashboards into detailed analysis reports. The charts in the report are fully editable, providing users with the flexibility to customize the content to their specific needs.
When compared to other data visualization tools on the market, ExcelDashboard Ai stands out for its simplicity and efficiency. It offers a user-friendly interface that is easy for newcomers to navigate, while also providing powerful features for more advanced users.
Overall, ExcelDashboard Ai is a must-have tool for anyone looking to unlock the full potential of their data. Whether you're a business professional, a researcher, or a student, this tool can help you make sense of your data and make more informed decisions.