Inkdrop: Visualizing and Managing Your Cloud Infrastructure
In the realm of cloud computing, having a clear understanding of your infrastructure is crucial. Inkdrop emerges as a powerful tool to address this need.
Overview
Inkdrop offers an effortless way to gain a comprehensive overview of your cloud infrastructure. It allows you to quickly get up to speed on what your infrastructure entails, which is especially beneficial for new team members during onboarding. Instead of spending hours deciphering complex setups, Inkdrop presents it all in an easily digestible manner.
Core Features
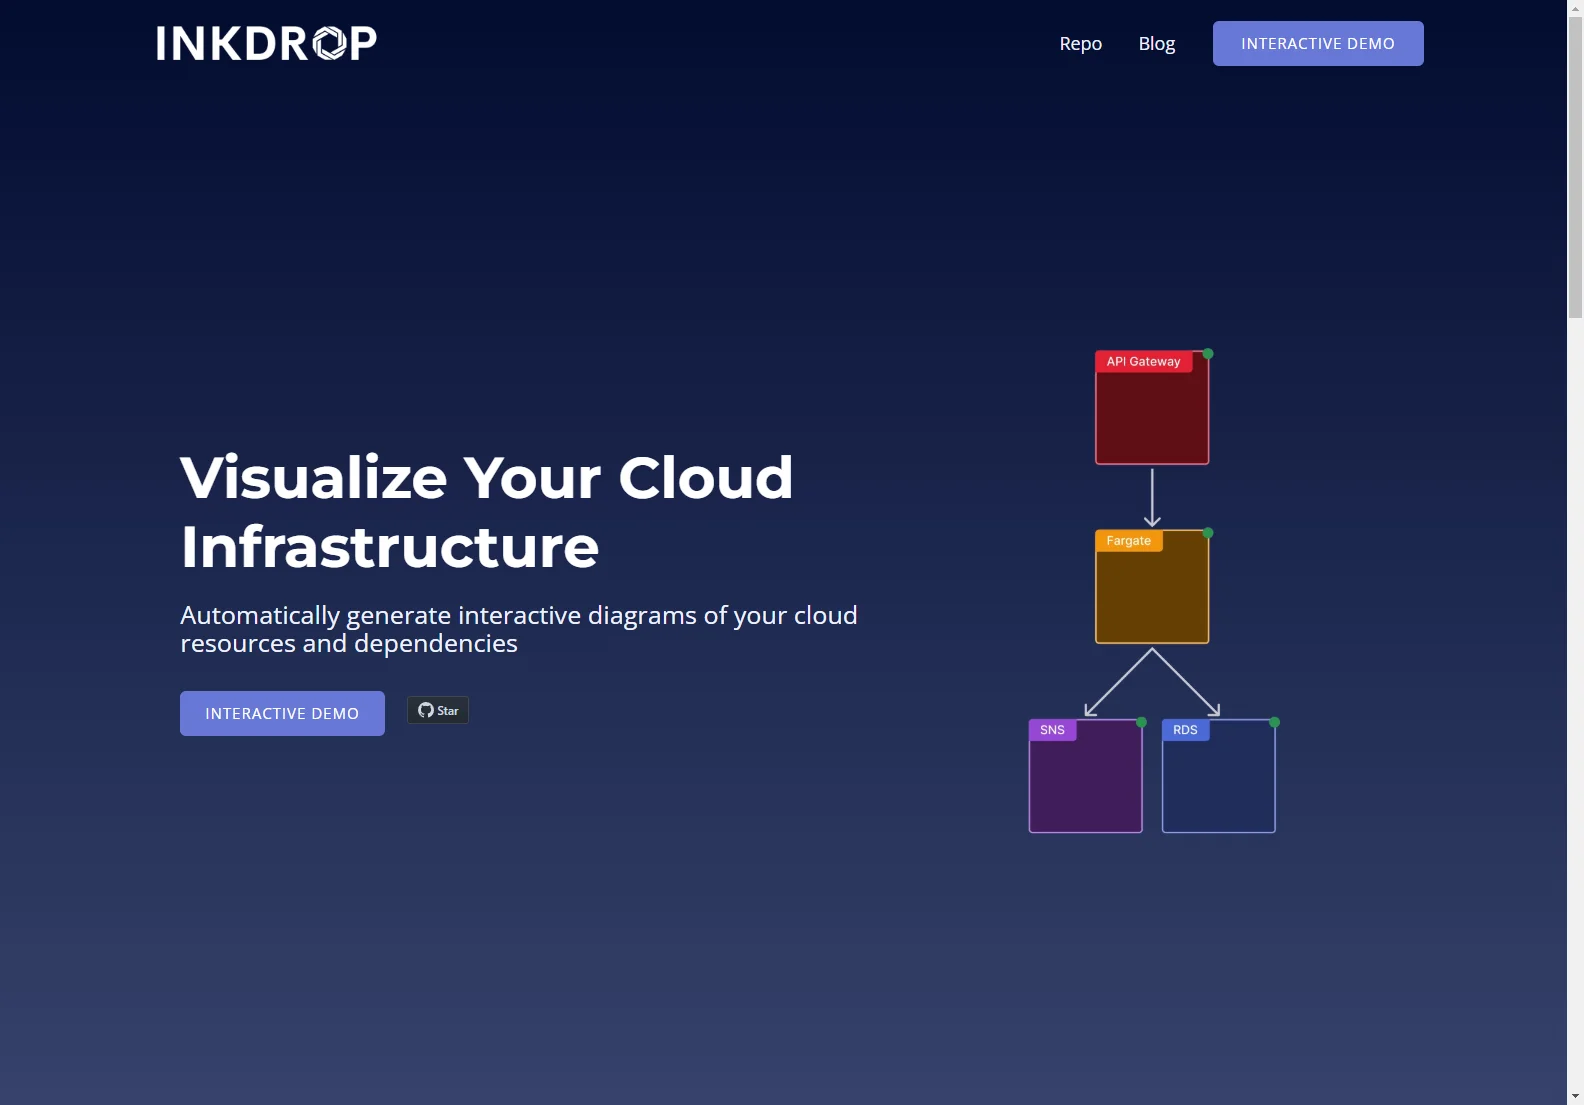
One of its standout features is the ability to automatically generate interactive diagrams of your cloud resources and dependencies. This visual representation helps in understanding the intricate relationships between different resources. For instance, when troubleshooting an issue, being able to see how various components are connected can significantly speed up the process. Another key aspect is its seamless integration, where it can automatically update documentation via CI pipeline integration, ensuring that your records are always up to date.
Basic Usage
Getting started with Inkdrop is relatively straightforward. Once you access the interactive demo, you can begin exploring how it visualizes your specific cloud setup. You can navigate through the diagrams to understand the flow of data and dependencies. And with its intuitive interface, even those with limited technical knowledge can make the most of it.
Compared to other existing AI solutions in the market for infrastructure management, Inkdrop stands out with its focus on visualizations. While some tools may offer text-based reports or analytics, Inkdrop's interactive diagrams provide a more immersive and intuitive experience. It truly bridges the gap between complex cloud setups and easy comprehension for users.