Lightrun: Revolutionizing Developer Observability
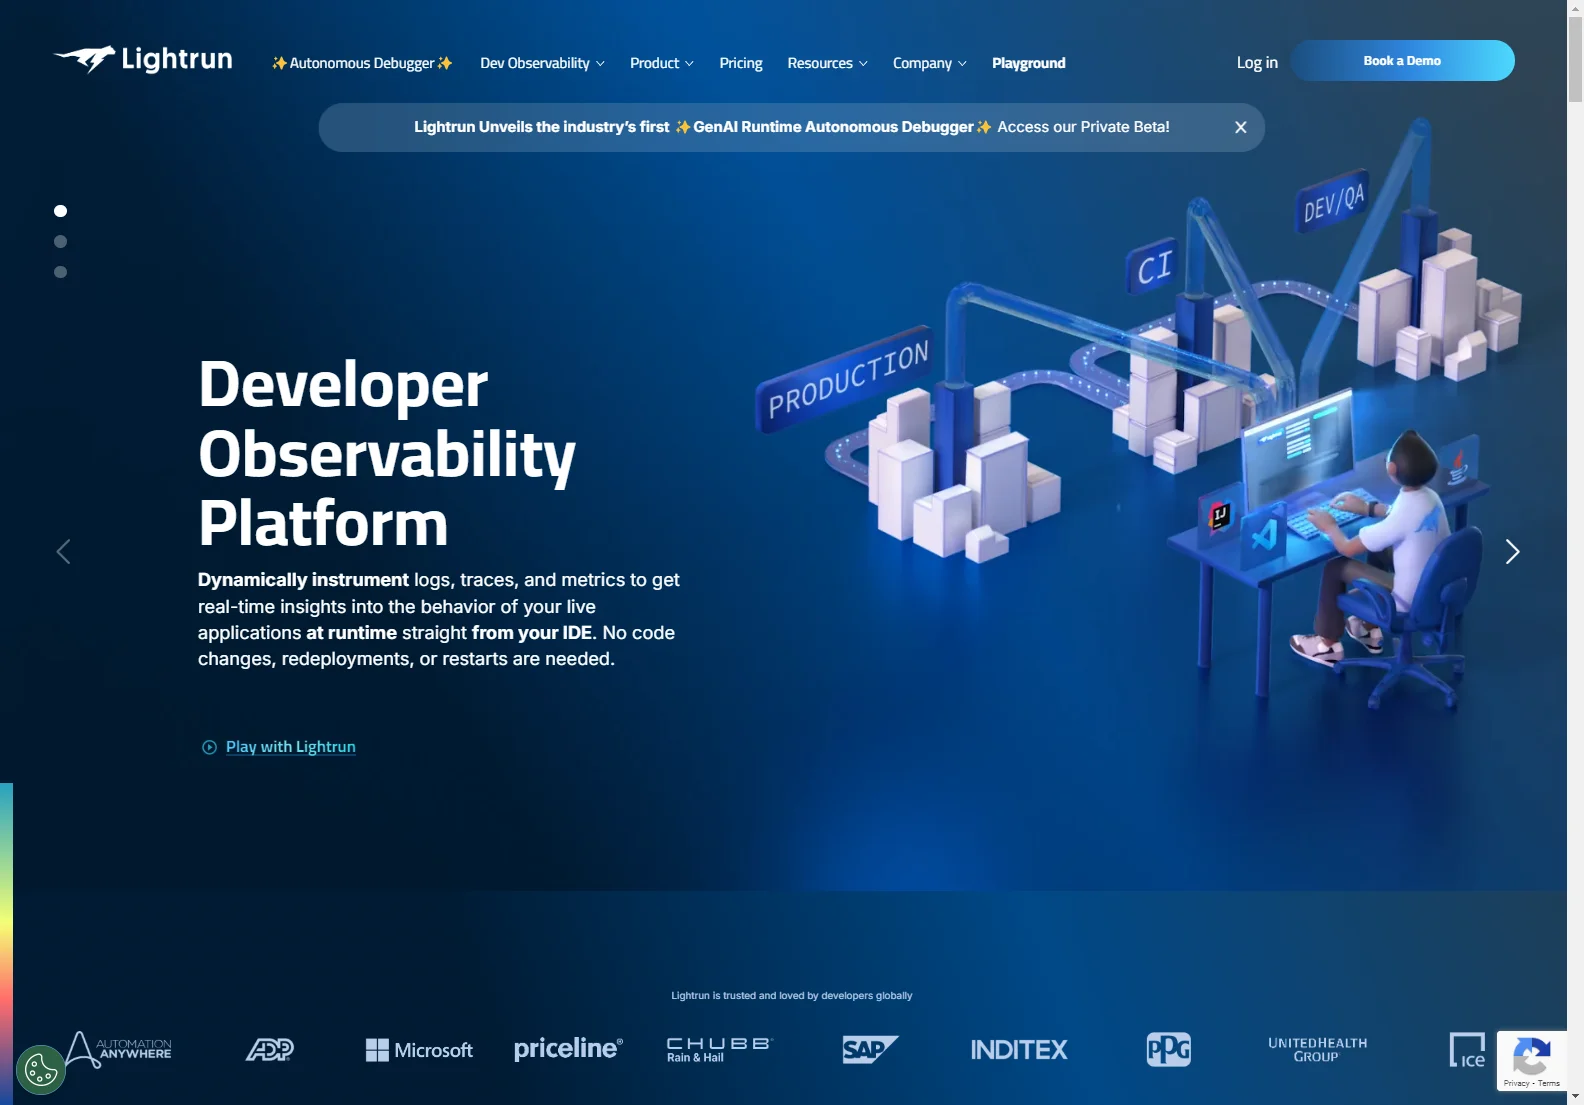
Lightrun is a game-changer in the world of developer observability. It allows developers to dynamically instrument logs, traces, and metrics to gain real-time insights into the behavior of their live applications at runtime directly from the IDE. With no need for code changes, redeployments, or restarts, Lightrun simplifies the debugging process.
The platform's core features are impressive. It securely injects logs, metrics, and traces in real time while the process is running, enabling debugging of various systems such as monoliths, microservices, K8s, CI, serverless, and more. Lightrun requires no source code access, and only metadata passes through the server. It is runtime-based and can scale to any size.
In terms of basic usage, developers can choose their IDE, including VSCode, JetBrains, and Visual Studio. They can then instrument their code, legacy code, or third-party code in real-time without stopping the live application. The observed information is immediately available in the IDE or through one of the 30+ observability integrations.
Lightrun offers several use cases. It enables live debugging in production, allowing developers to capture context in real-time without stopping execution. It also helps troubleshoot cloud-native applications, broken CI, serverless applications, and more. Additionally, it can be used for performance analysis and investigation, and to reduce logging costs.
The platform has received positive reviews from users and industry experts. Companies like Taboola and Salesforce have experienced significant benefits from using Lightrun. It has also been recognized for its security and privacy features, as it is ISO-27001, SOC 2, GDPR, and HIPAA-compliant.
In conclusion, Lightrun is a powerful tool that empowers developers to improve the observability and debugging of their applications, leading to increased productivity and efficiency.